
How to Look Up Tulsa County Jail Population Data
Population data lives in a few places. The Sheriff's online roster gives a live count of current inmates. The detention division publishes the jail's bed capacity. Outside groups, such as the Vera Institute and the Bureau of Justice Statistics, add trend and context numbers. Each source answers a different question, so it helps to know what each one measures before you read it.
The roster is the most current source. It updates through the day and exposes a total count of current inmates. When the roster was inspected on May 26, 2026, the "All" tab returned 1,455 current inmates. That is a live snapshot, not an audited average. The roster does not publish a demographic summary, though each booking lists gender, race, age, and charges.
The roster also offers three views that tell you how the count moves. The Recent tab shows bookings in the last 48 hours. The All tab shows everyone in custody now. The Recent Releases tab shows people let out in the last 48 hours. Together, the bookings-in and releases-out give a rough sense of flow, even though the page does not chart it for you.
Tulsa County Jail Capacity Overview
Capacity figures differ by source, and both are worth knowing. The detention page says David L. Moss opened in 1997 with 1,714 beds. The Sheriff's bio describes it as a 2,000-bed facility with medical and mental health services. The first figure is the opening design capacity; the second is a broader descriptive figure. Operating capacity can differ from design capacity, so a count below the bed number does not always mean empty space.
| Measure | Number | Source |
|---|---|---|
| Opening bed capacity (1997) | 1,714 beds | TCSO detention page |
| Descriptive capacity | 2,000 beds | Sheriff Vic Regalado bio |
| Live roster count (May 26, 2026) | 1,455 inmates | Sheriff roster total count |
Note: A snapshot of 1,455 sits below both bed figures, but design capacity and operating capacity are not the same, so this is not proof of empty space.
Average Daily Population
Average daily population is the mean number of people held over a period, such as a month or a year. It smooths out the daily ups and downs that a live roster shows. It is the figure researchers use to compare jails over time.
The official Tulsa County pages reviewed for this site did not publish a current average daily population, a five-year trend, or a budget figure. That is a gap in the official data, not a sign that the number does not exist. For a trend estimate, the Vera Institute is the better source, and it is covered below.
Why does the difference matter? A live count can swing by dozens of people from morning to night as bookings come in and releases go out. An average daily population irons out that noise. If you want to compare Tulsa County to another county, or to last year, the average is the fair measure. If you want to know who is in the jail right now, the live roster is the one to read.
Demographic Breakdown
The roster does not publish a demographic summary. It does, however, list gender, race, age, birth date, booking date, charges, and bail amount for each booking. In theory, an analyst could build a snapshot from those public rows. The jail itself does not post a ready-made breakdown by race, age, or gender.
Because of that, any demographic claim about the Tulsa County jail should be sourced carefully. A live roster can be counted, but it changes by the hour. For a stable demographic picture, a research dataset is more reliable than a single-day roster pull.
Pretrial vs Sentenced Population
Jail population splits into two broad groups. Pretrial inmates are held before a case is decided, often because they cannot post bond. Sentenced inmates are serving a short county sentence. A county jail holds far more pretrial people than a state prison does, because the jail is the front door of the system.
| Group | Meaning |
|---|---|
| Pretrial | Held before trial, often on an unmet bond. |
| Sentenced | Serving a short county sentence after conviction. |
| Hold / transfer | Held for another agency or awaiting transfer. |
The official pages reviewed did not publish a current pretrial-to-sentenced ratio for the David L. Moss jail. Treat any such split as an estimate unless the Sheriff or a research source provides it. The split matters for policy debates, since a large pretrial share points to bond and case-processing issues rather than to long sentences.
Misdemeanor vs Felony Population
Charges also split the population. Many bookings carry felony charges, often with the CF prefix on the related court case. Others carry misdemeanor charges under CM, or traffic and wildlife matters. The roster shows the charge and statute for each booking, so the charge mix can be read case by case.
A felony charge tends to come with a higher bond, which can mean a longer pretrial stay. A minor misdemeanor may resolve in days. The charge type, the bond, and the court schedule together shape how long a person stays in the jail. That mix of stay lengths is part of why a live count and an average daily population can differ so much.
Mental Health and Medical Population
The jail provides medical and mental health services, which the sheriff's account describes as part of the facility. Care is provided by a contracted medical provider. A booking nurse screens new inmates at intake, and serious cases are treated and cleared before admission.
The official pages reviewed did not publish a count of inmates receiving mental health or medical care. That figure is not part of the public roster. For broader context on jail health needs, national research from the Bureau of Justice Statistics is a better guide than a single roster pull. Many jails report a sizable share of people with mental health or substance needs, which is part of why Tulsa County built treatment-focused specialty courts.
National and State Context
National numbers put a county jail in perspective. The Bureau of Justice Statistics publishes jail-inmate reports that track jail populations, pretrial detention, and rates per 100,000 residents across the country. Those reports do not give a Tulsa-specific daily count, but they frame what a typical county jail looks like.
The Bureau of Justice Statistics publishes the national jail data used for this kind of comparison.
Use these reports for a benchmark, then compare them to Tulsa County and state figures. A rate per 100,000 residents lets a small county and a large one be compared on equal footing.
| Level | What It Measures |
|---|---|
| County | David L. Moss roster count and bed capacity. |
| State | Oklahoma jail and prison trends. |
| National | BJS rates per 100,000 residents. |
Population Trends Over Time
For a Tulsa County trend, the Vera Institute is the source called out for county-level context. Vera publishes incarceration trends for Tulsa County that can supplement the official current count and bed capacity. A trend view shows direction over years, which a one-day roster cannot.
The Vera Institute Tulsa County trends page tracks county incarceration over time.
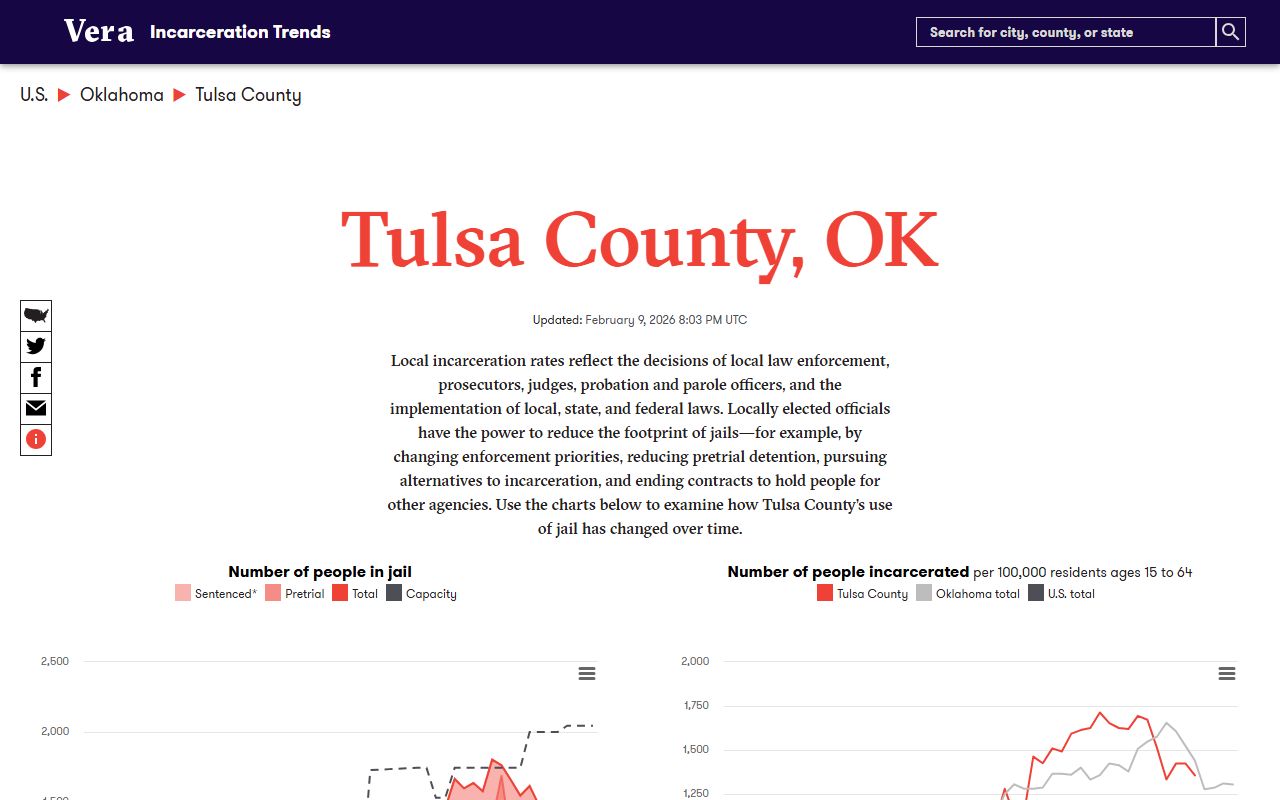
Pair the Vera trend with the official capacity figures for a fuller picture than any single number gives.
A trend can reveal things a snapshot hides. A jail can sit below its bed count today yet show a rising multi-year line, or the reverse. Trends also let you compare Tulsa County with the state and the nation on a per-resident basis, which a raw headcount cannot do. When you cite a trend, note the years it covers and the source that built it.
Searching for Tulsa County Inmate Records by Name
This page covers population data, not individual lookups. To find a specific person, use the Sheriff's roster, which is covered on the Tulsa County inmate records page. For releases, see the released inmates page. A name search returns one person's booking; population data describes the whole jail, so the two answer very different questions.
Where the Data Comes From
Three sources carry most of the weight here. The Sheriff's roster gives the live count and the per-booking detail. The detention division gives the bed capacity. Vera and BJS give trend and national context. When numbers disagree, check which one you are reading: a live count, a design capacity, or an average over time.
Be careful with the word overcrowded. It only fits when a verified current population is compared to a verified current operating capacity. A snapshot below the bed number does not prove free space, and a snapshot near it does not prove a crisis. Cite the source and the date for any population figure you use.
One more reason to keep the sources straight: the jail roster is run by the Sheriff, while trend data is built by outside researchers from records they gather over time. A live number and a research estimate will rarely match to the person, and that is normal. They are measuring different windows. The honest way to use them is together, each labeled for what it is.